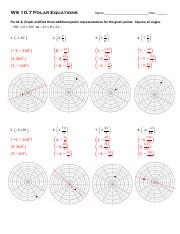
Polar equations are a unique way of representing mathematical functions. They involve using polar coordinates instead of Cartesian coordinates, which can lead to some interesting and beautiful graphs. In this worksheet, we will explore how to graph polar equations and find the area enclosed by these curves.
Graphing polar equations involves plotting points in the polar coordinate system, where the distance from the origin (r) and the angle from the positive x-axis (θ) determine the position of a point. By varying the values of r and θ, we can create different shapes and curves.
Graph and Find Area of Polar Equations Worksheet
One common type of polar equation is the equation of a circle, which can be represented as r = a, where a is the radius of the circle. By varying the value of a, we can create circles of different sizes. To graph this equation, we can plot points for different angles and connect them to form a circle.
Another interesting type of polar equation is the equation of a cardioid, which can be represented as r = a(1 + cosθ). This equation creates a heart-shaped curve when graphed. To find the area enclosed by this curve, we can use the formula for finding the area of a polar region: A = 0.5 ∫[a, b] (f(θ))^2 dθ, where f(θ) is the polar equation.
When finding the area of a polar region, it is important to remember to integrate with respect to θ and to square the function f(θ) before integrating. This will give us the correct area enclosed by the polar curve. We can use this method to find the area of any polar region, not just circles and cardioids.
In conclusion, graphing and finding the area of polar equations can be a fun and challenging exercise in mathematics. By understanding the polar coordinate system and how to represent functions in polar form, we can create beautiful graphs and calculate the area enclosed by these curves. This worksheet is designed to help you practice these skills and deepen your understanding of polar equations.
